
I was able to pinpoint exactly the areas that I need to address to resolve resource conflicts, improve utilization and overall revenue!
Emil Ocon
Senior Project Manager
Innovative Discovery
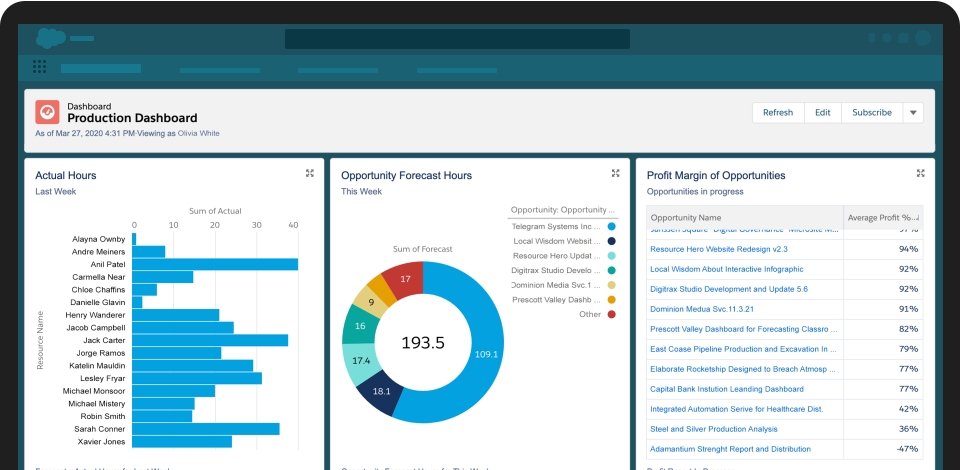
See your business like you’ve never seen before
When forecasting, time tracking, and other data points converge, you can visualize the big picture down to the smallest detail. Whether you’re an individual, a team lead, or the CEO, resource reports, coupled with the Salesforce reporting engine, help you balance workload, course-correct faster, and make data-driven decisions.

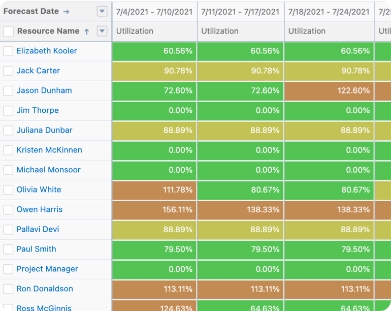
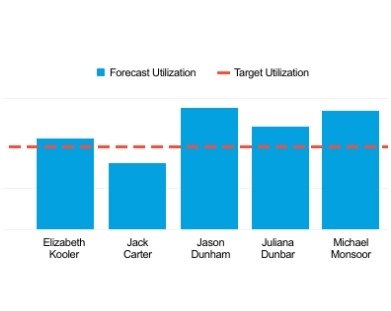
Resource Utilization
See your team’s workload in the future based on utilization targets.
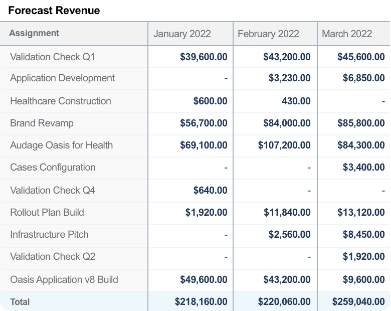
Revenue and Profits
See the future pipeline based on forecasted hours, bill rates, and resource costs.
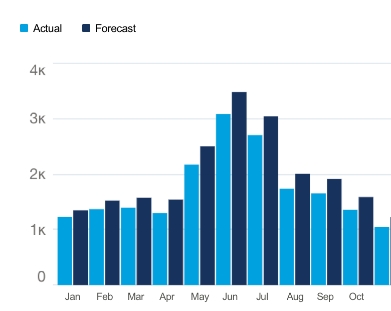
Forecast vs. Actual
Compare forecasts against actuals for a project or across the entire organization.
Workforce Planning
See which resource roles you might need in the future as you plan your project pipeline.
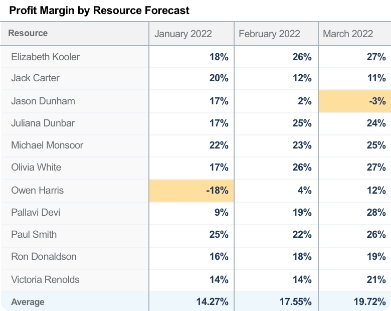
Profit Margins
Use resource forecast hours and bill rates to calculate expenses and profit margins.
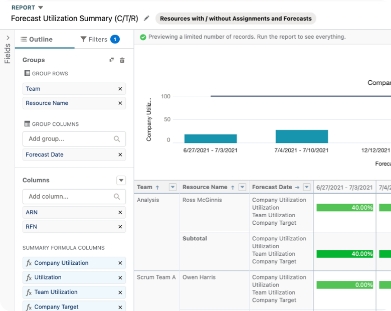
Endless Possibilities
The Salesforce reporting engine allows you to visualize your data in countless ways.
Democratize and surface data for all
Data flows through our organizations at a tremendous speed. However, resource reports are valuable when people see it, at a time when something can be done, and have the ability to take action. Resource Hero data combined with the Salesforce platform allows you to surface the data in meaningful and actionable ways for your team.
